
NERA Economic Consulting has compiled annual reports on trends in wage and hour settlements since 2007. Their latest report offers an update on wage and hour settlement trends for 2014 and 2015 with the addition of 27 months of civil wage and hour data. Through their 8 month analysis, they identified all allegations made in the cases and classified them in the following categories:
- Overtime
- Off-the-clock work
- Minimum wage violation
- Donning and doffing
- Missed meals and breaks
- Misclassification
- Tip pooling
Case Characteristics in Wage and Hour Disputes:
- Many cases had multiple allegations. About 60% of cases had at least two allegations, and another 55% included an allegation of overtime in addition to one or more allegation. Only 16% of the cases alleged overtime alone.

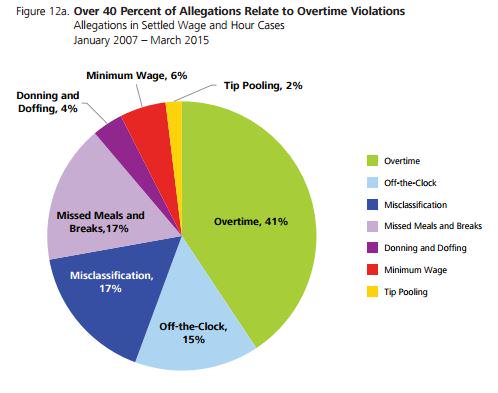
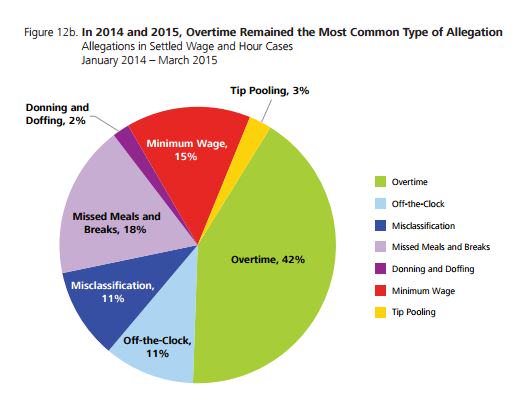
- Overtime allegations continue to dominate. This pattern has remained steady from years prior. Misclassification and off-the-clock allegations were slightly down in 2014 and 2015 compared to the years before while minimum wage violations increased.

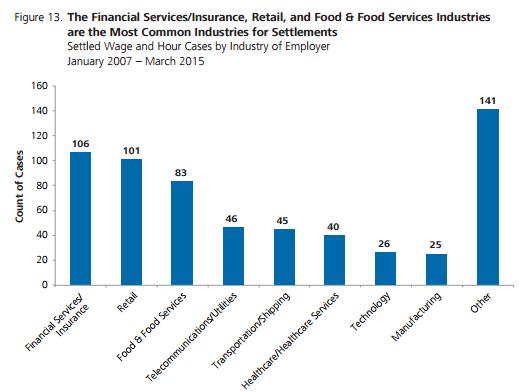
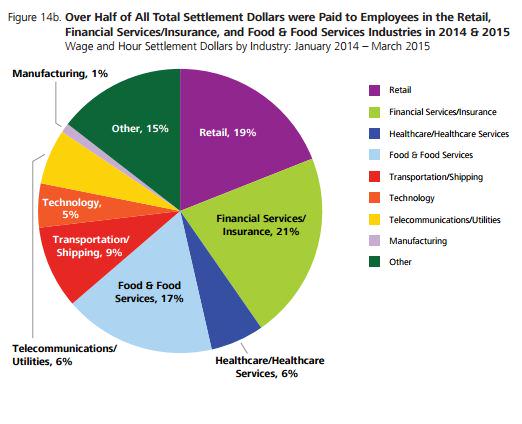
- Retail was the most common industry of settling defendants. The three most common industries for settling defendants over the years were financial services/insurance, retail, and food and food services. This pattern continued into 2014 and 2015, with the most common industry of settling defendants being retail, followed by financial services and food and food services.

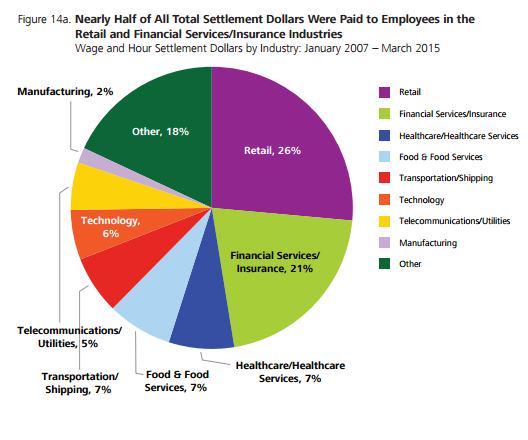
- Retail, financial services and food services accounted for more than half the total spending in 2015 and 2015. For the last 15 months, 21% of settlement dollars were paid to workers in the financial services/insurance sector, 19% of settlement dollars were paid to workers in the retail industry, and 17% were paid to workers in the food & food services industry—totaling, 57% of all spending. For all years that NERA has surveyed, these three industries comprised 54% of total spending.


- The majority of the cases in the three main industries included allegations of overtime. The second more frequent allegation in the finance/insurance industry was misclassification. In retail, there were allegations of overtime violations, missed meal breaks, off-the-clock work and misclassifications. There were relatively few allegations of misclassification in food and food services industry, but that industry had other types of alleged violations including donning and doffing, missed meals and breaks and off-the-clock work.
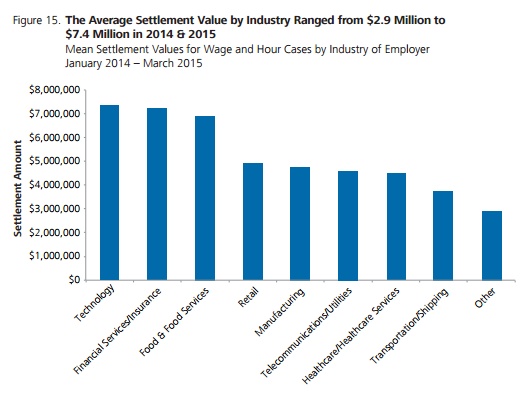
- Settlements in the technology sector were the highest in terms of dollar amount. This was followed by settlements in the financial services/insurance and food and food service industries.

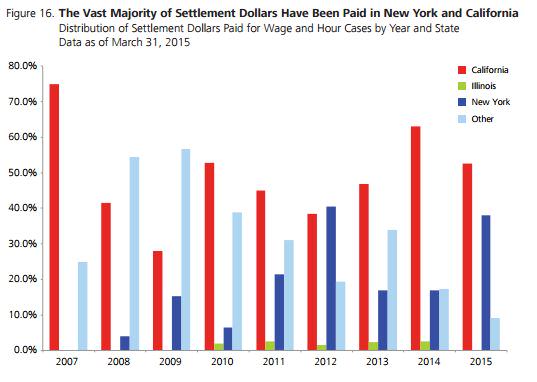
- The majority of settlement dollars have been paid out in New York and California. This is consistent with trends in years prior.

In time of budgetary constraints, every dollar counts. Wage and hour lawsuits continue to climb. Protect yourself against wage and hour lawsuits, specifically overtime violations, and meal break violations. To see how EPAY can help your business avoid costly settlement costs, set up a demonstration today.
Source: http://www.nera.com/content/dam/nera/publications/2015/PUB_Wage_and_Hour_Settlements_0715.pdf